Reports
See how your restaurant is doing and close out every day and every shift with numbers you can trust. Every report counts in your location's own time zone, and each one asks for the dates it actually needs: one business day, a range of days, or an exact shift with its start and end time.
Overview
With reports you can:
- 📈 Follow sales on the dashboard over any period, compared with the period before
- 🍽️ See which items sold, for a day, a week, or a single service such as Friday dinner
- 🧾 Close out each business day with the End of Day report
- 👤 Close out each staff member's shift, even if they never clock in
- 📤 Export sales, daily totals, and tax for your accountant, as PDF or CSV
- 🖨️ Print any report on your receipt printer
Where to find reports
You must first navigate to a specific restaurant location. For restaurant groups/chains, select your location from the Group/Chain Dashboard first.
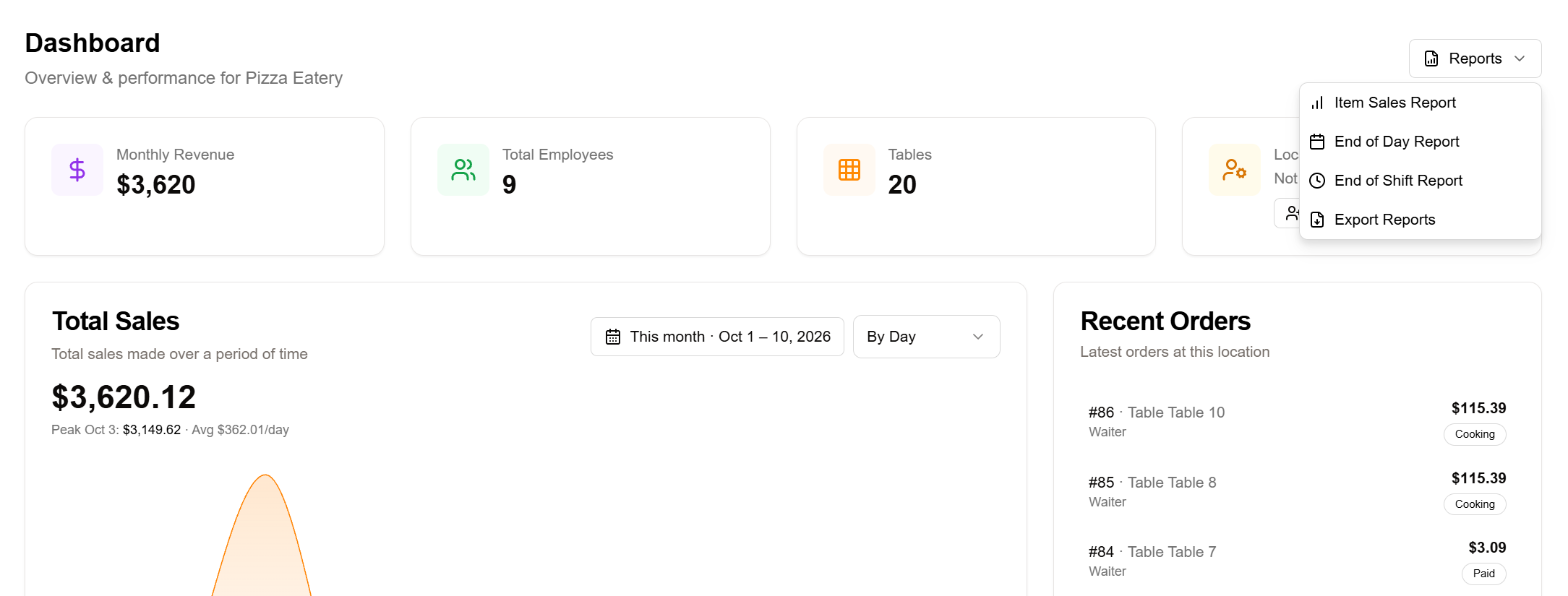
Navigation Path: [Your Location] → Dashboard → Reports (top right)
The Total Sales chart is on the Dashboard itself. The other reports open from the Reports button.
| Report | Answers | Dates you choose |
|---|---|---|
| Total Sales chart | How are sales trending, and how do they compare with before? | A range of days |
| Item Sales | What sold, how many, and for how much? | A range of days, optionally a time window |
| End of Day | How did today go, and does the cash add up? | One business day |
| End of Shift | How did this person's shift go? | One staff member, the shift's date and its start and end time |
| Export Reports | What do I send my accountant? | A range of days, with periods that suit each report |
Reports count in the time zone set for the location, not the time zone of the computer you're on. A business day runs from midnight to midnight there. A sale at 10:30 PM belongs to that day, even if it's already tomorrow in UTC or wherever you are when you run the report. You can set the time zone in Location Settings.
Choosing dates
Picking a range of days
The Total Sales chart, Item Sales and Export Reports use the same range picker.
- Click the dates button. It shows the current range, for example Last 7 days · Oct 3 – 9, 2026.
- Click a quick range on the left to apply it straight away, or:
- Click the first day of your range. Your previous range is cleared, and the range previews as you move the mouse.
- Click the last day. The range is applied and the picker closes. You can click the last day before the first one; the picker puts them in order.
- One day: click the same day twice.
- Change your mind: press Esc or click Reset before picking the last day. Nothing changes until the range is complete.
- Future days can't be picked; there's nothing to report yet.
| Quick range | Covers |
|---|---|
| Today / Yesterday | That business day |
| Last 7 days / Last 30 days | The last 7 or 30 days, including today |
| This week / Last week | Monday to today / Monday to Sunday of last week |
| This month / Last month | The 1st to today / the whole of last month |
| This quarter / Last quarter | The quarter so far / the whole of last quarter |
| This year / Last year | January 1 to today / the whole of last year |
Each report offers the quick ranges that suit it. For example, Tax Summary exports offer months, quarters and years.
Picking one business day
End of Day and End of Shift take a single day. Click Today or Yesterday, or pick any earlier day from the calendar.
Adding a time window
Item Sales and End of Shift also take a time of day. By default they cover whole days, from 12:00 AM to 11:59 PM. Type a From and To time to narrow the report to a service or a shift:
- Lunch service: 11:00 AM – 3:00 PM.
- Overnight: if the end time is earlier than the start time on a single day, the window ends the next day. For example, 5:00 PM – 1:30 AM. The line under the times always spells out the exact window, for example From 5:00 PM on Oct 9, 2026 to 1:30 AM on Oct 10, 2026 (overnight).
- Whole day puts the window back to the full day.
Total Sales chart
The Total Sales chart on the Dashboard shows your sales over the dates you choose.
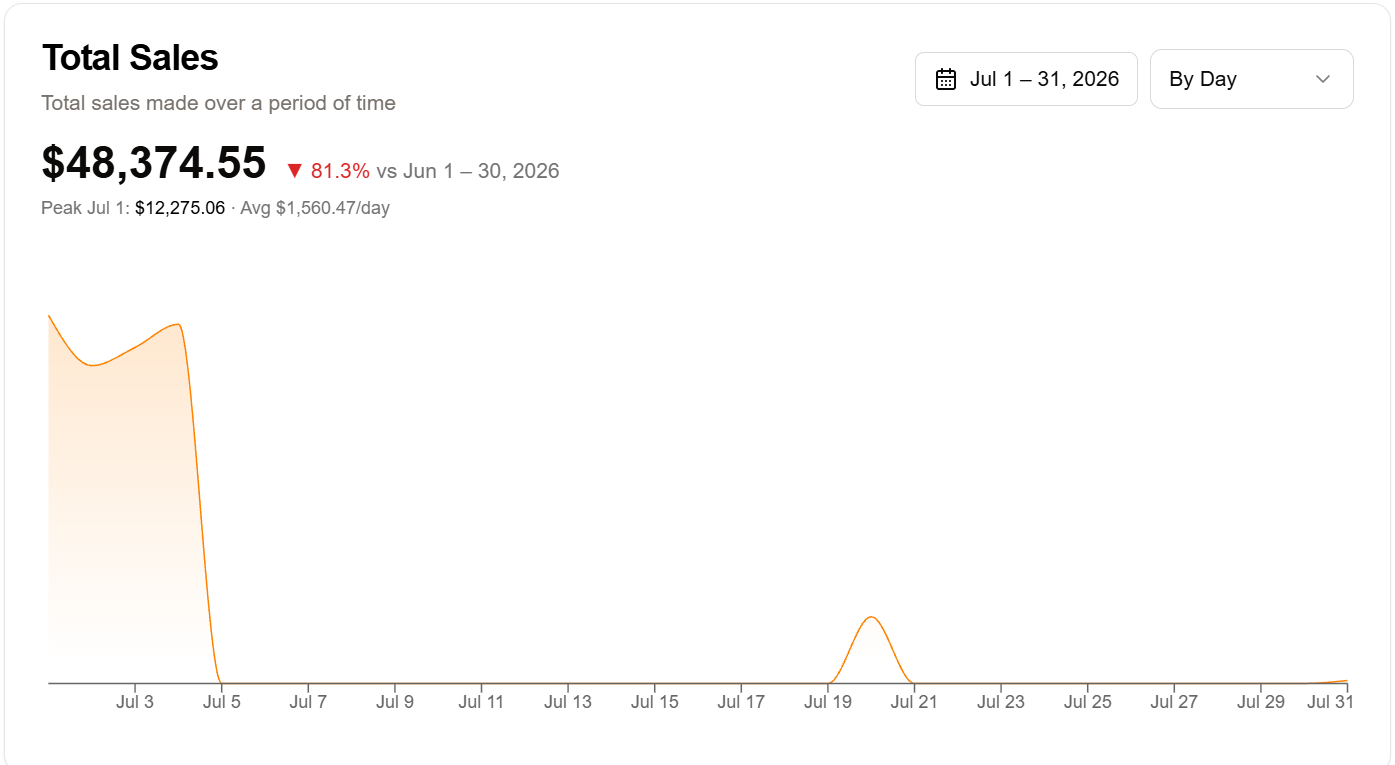
- The total for the period sits at the top, with the change against the comparison period (for example ▲ 12.4% vs Sep 1 – 9, 2026).
- Peak is the best hour, day, week or month in the period. Avg is the average per hour, day, week or month, quiet ones included.
- Quiet days show as $0, so the chart never draws a line across a day with no sales.
- Refunds lower the total on the day they're given.
How sales are grouped
The chart picks a sensible grouping for the range you choose:
| Range | Grouped by |
|---|---|
| One day | Hour |
| Up to about 2 months | Day |
| Up to about 6 months | Week |
| Up to about 2 years | Month |
| Longer | Year |
To see it differently, choose By Hour, By Day, By Week, By Month or By Year. Your choice stays until you change the dates.
What it's compared with
| You're looking at | Compared with |
|---|---|
| Month to date (e.g. Oct 1 – 9) | The same days of last month (Sep 1 – 9) |
| A full month (e.g. September) | The full month before (August) |
| Year to date (e.g. Jan 1 – Oct 9) | The same days last year |
| Any other range | The same number of days just before it |
Chains and groups get the same chart for all their locations combined on the Group/Chain Dashboard.
Item Sales Report
What sold, how many, and for how much, item by item.
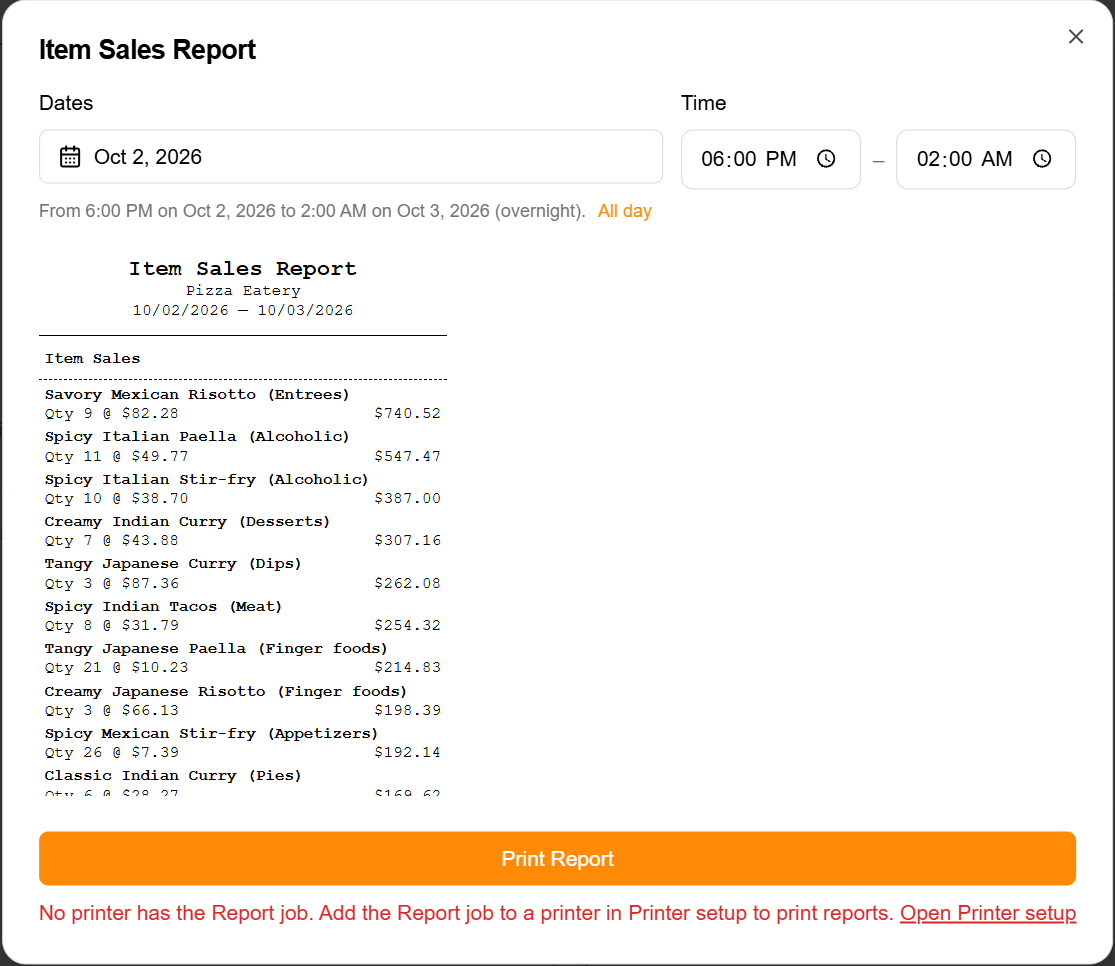
- Open Reports → Item Sales Report. It opens on Today.
- Choose the Dates, and if you want, a Time window (see Adding a time window).
- The report updates as you go. Click Print Report to print it.
For each item: its POS code, name and category, the quantity sold, the price, gross sales, discounts and net sales.
Use it to:
- Find your best sellers and the items that don't move
- Compare lunch with dinner, or this Friday with last Friday
- Check a promotion or a new dish over the days it ran
Items count once per order, however many payments the order was split into. Refunded and voided sales aren't counted as sold.
End of Day Report
Everything you need to close out one business day.
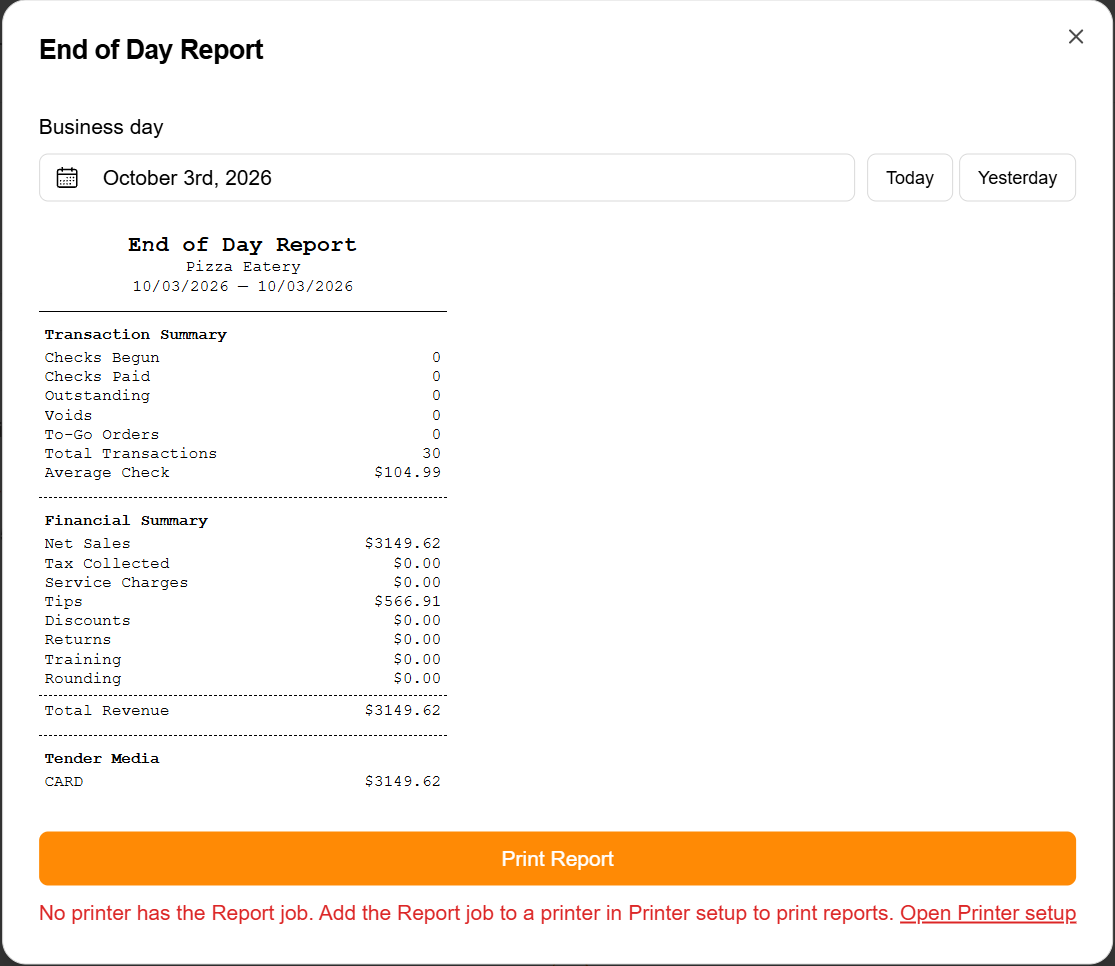
- Open Reports → End of Day Report. It opens on today.
- Pick the Business day: Today, Yesterday, or a day from the calendar.
- Review it, then click Print Report if you keep a paper copy.
What's included:
| Section | Shows |
|---|---|
| Transaction summary | Checks begun, paid and outstanding, voids, to-go orders, total transactions, average check |
| Financial summary | Net sales, tax collected, service charges, tips, discounts, returns, total revenue |
| Tender media | Totals by payment method (cash, card, …) |
| Cash drawers | The day's drawers: how many (and how many are still open), opening floats, counted at close, drops to the safe, pay-outs and pay-ins, how many are waiting for review and how many were closed without a count. People who can see variances also see expected cash and the day's variance. On screen only; not on the printed report. See Cash Drawers. |
A business day is midnight to midnight in your location's time zone. Late-evening sales are on that day's report, not the next day's.
End of Shift Report
One staff member's shift: hours, sales, tips, adjustments and their cash drawer. It works whether or not your team clocks in. You enter the shift's start and end time, and clock-ins, when there are any, fill them in for you.
- Open Reports → End of Shift Report.
- Choose the Employee.
- Choose the Shift date: the day the shift started.
- Set the Shift time:
- Type it: for example 5:00 PM – 1:30 AM. A shift past midnight ends the next day.
- Use a clock-in: if the employee clocked in that day, each clock-in is offered as a button, for example Clock-in 12:26 PM – 6:54 PM. Click it to fill in the times; you can still adjust them. A shift that's still open shows – now.
- Whole day: leave the times at 12:00 AM – 11:59 PM to see everything the employee did that day.
- Click Print Report to print it.
What's included:
| Section | Shows |
|---|---|
| Shift information | Employee, shift start and end, hours worked |
| Sales | Orders served, total sales, tax collected, average order value, revenue per hour |
| Gratuity | Tips (cash and card) and service charges |
| Adjustments | Discounts, voids and refunds (count and amount) |
| Cash drawers this shift | Every drawer they held during the shift (more than one after a handover): when it was open, its review state, the opening float and the count. People who can see variances also see expected cash and variance. On screen only; not on the printed report. See Cash Drawers. |
| Tender media | Totals by payment method |
The report counts the employee's sales, voids and refunds made inside the shift time. Orders served counts each order once, even if it was paid in several payments.
Export Reports
Download a report as a file for your accountant, your spreadsheet, or your records.
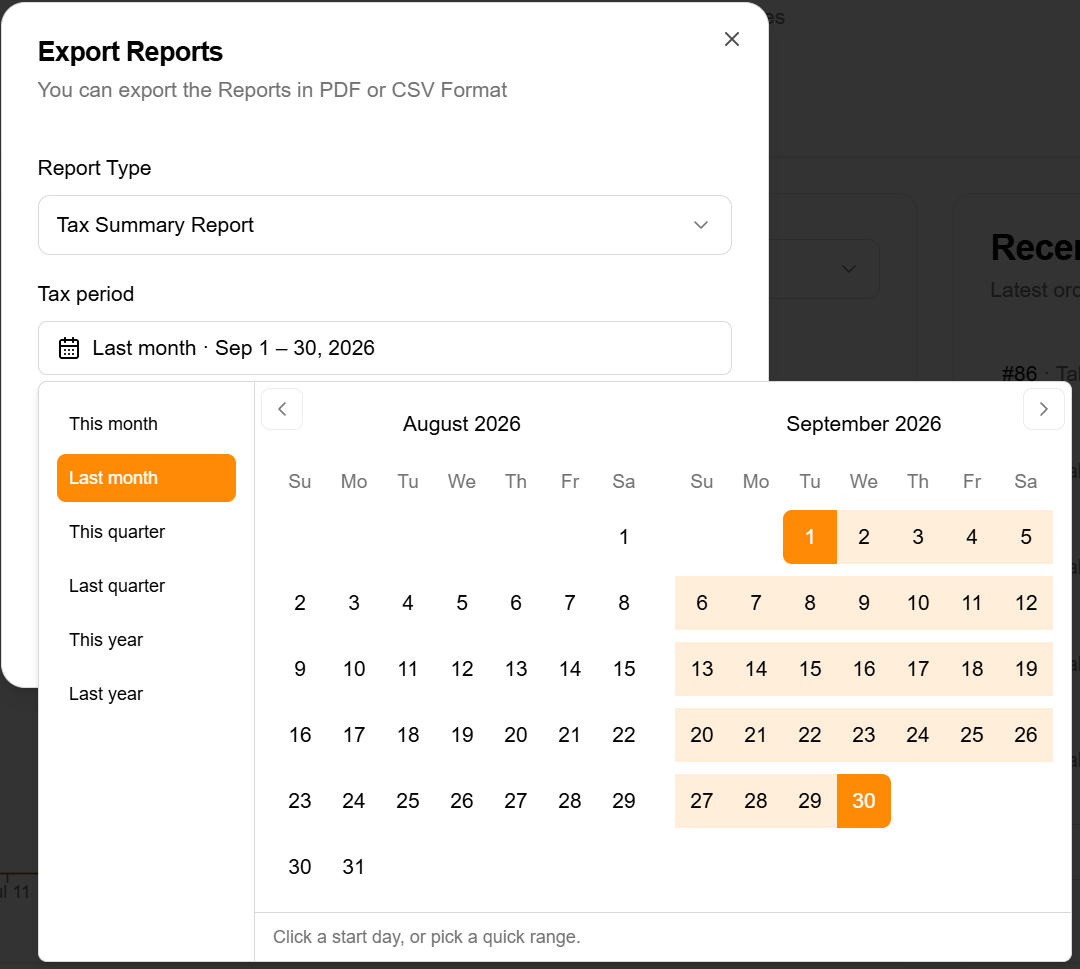
- Open Reports → Export Reports.
- Choose the Report Type first. The dates below it change to suit the report.
- Choose the dates. Exports always cover whole days in your location's time zone.
- Choose PDF or CSV, then click Export Report. The file downloads to your device.
| Report type | The file contains | Dates | Starts on |
|---|---|---|---|
| Sales Report | Every item with its category, unit price, quantity sold, total and share of sales; totals by category; net sales, tax, discounts, refunds, voids, transactions, items sold, average ticket and average item price; totals by payment method | Dates | Last 7 days |
| End Of Day Report | One line per business day: gross sales, tips, discounts, taxes and transactions | Business days | Last 7 days |
| Tax Summary Report | Tax collected for each tax and rate, on orders placed in the period | Tax period: months, quarters, years | Last month |
- PDF is for printing and sharing. CSV opens in Excel, Google Sheets, Numbers, and most accounting software.
- Refunds and voids in a Sales Report cover the same days as its sales.
Printing reports
Item Sales, End of Day and End of Shift each have a Print Report button. To print on a receipt printer, give a printer the REPORTS job type in Printer Management. If no printer has it, the report says so under the button and you can print from your browser instead.
Who can see what
| Report | Roles |
|---|---|
| Total Sales chart | Location Manager, Chain Manager, Accounting |
| Item Sales | Location Manager, Chain Manager, Accounting |
| End of Day | Location Manager, Chain Manager, Floor Manager, Accounting, Wait Staff |
| End of Shift | Location Manager, Floor Manager, Cashier, Accounting |
| Export Reports | Location Manager, Chain Manager, Accounting |
Organization Admins can see everything. A report you can't see isn't listed in the Reports menu. You can adjust any of this per person under Employee Management.
Best practices
Close out every day
- At the end of the day, open the End of Day Report for Today.
- In Cash drawers, check nothing is waiting for review or closed without a count. Review drawers and force-close any left open on the Cash page.
- Check the card total against your payment processor's report for the same day.
- Print it or export it for your records.
Close out every shift
Run the End of Shift Report before the staff member leaves, while the shift is fresh. If your team doesn't clock in, type the times they actually worked.
Review the week
- Total Sales with Last 7 days, to compare against the week before.
- Item Sales for last week, to spot trends. Try a time window to compare lunch and dinner.
Month end and tax time
- Export the Tax Summary Report with Last month (or Last quarter) for filing.
- Export the End Of Day Report for the same period as CSV, to reconcile day by day.
- Export the Sales Report for the period and keep the PDF with your records.
Troubleshooting
Two reports show different totals for the same day
Check that they cover the same window:
- Item Sales or End of Shift with a time window covers only that window, while End of Day always covers the whole business day.
- The Tax Summary counts orders by when they were placed. Sales reports count payments by when they were made. An order placed late on the last day of the month and paid after midnight falls in different periods.
A late-night sale is on the "wrong" day
Reports use your location's time zone. Check that the time zone in Location Settings is correct. For a bar that closes after midnight, use a time window, for example 5:00 PM – 2:00 AM, to see the whole night together.
I can't pick tomorrow, or a future date
That's intentional; there's nothing to report yet. Days after today in your location's time zone can't be selected.
The chart total is lower than I expected
Refunds are subtracted on the day they're given. Days with no sales count as $0 in the average.
No clock-in buttons on End of Shift
The employee didn't clock in on that shift date, or you picked the wrong day. A shift belongs to the day it started. Type the shift time instead; the report doesn't need a clock-in.
The export doesn't download
Allow downloads from SSP Manager in your browser, then try again. For a very long period, export a shorter one (for example, one month at a time).
I don't see the Reports button or a report
Your role may not include it. See Who can see what, and ask your manager or Organization Admin.
Related Features
- Cash Drawers: floats, counts, variances and sign-off
- Attendance Tracking: clock in and clock out
- Tax Management: tax configuration
- Payment Management: payment processing
- Printer Management: print reports on a receipt printer
- Location Settings: time zone
Getting Help
Need assistance with reports?
- 📧 Email: support@ssppos.com
- 💬 Live Chat: Available in your dashboard
- 📚 Help Center: docs.ssppos.com